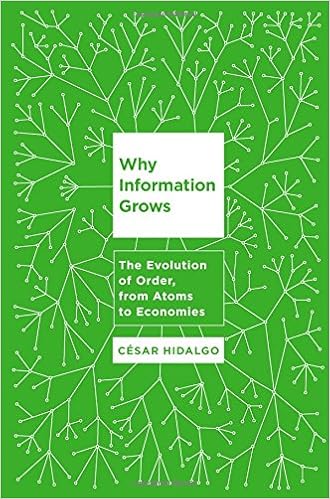
Why Information Grows: My Thoughts

It is not an overstatement to say that this is THE book to read if you want to learn anything about an emerging view of why and how countries grow.

A key take-away for me is the importance of assessing development, not in terms of what people can buy, but instead what people can make. This knowledge and know-how, Cesar describes, is embodied in the products that countries exchange with each other. He thus proposes a new way of thinking about international trade as really an exchange of crystals of imagination (i.e., the products that embody knowledge and know-how). 

As to why some places exhibit more "imagination" or crystalization thereof (or make more sophisticated products) he offers an explanation grounded on the difficulties of fostering "links" to create dense networks from which individual "personbytes" can be combined to make more imaginative products. Transaction costs make it difficult to bring knowledge and know-how together. Things like a common language help lower these costs and allow diverse people from across the world to collaborate at places like Harvard and MIT to bring new products to life.

A must read!

Comments

  1. I read once somewhere : " students in harvard think it is easier to do a project and make money rather than working for a company after graduation". If books such as this are the resources that motivate thise thoughts, we should also encourage it in UKM :D though the distance between UKM and Harvard and MIT is like 2 parsec :D

    ReplyDelete

Post a Comment

Constructive feedback is always welcome. Thank you

Popular posts from this blog

Mapping the Matrix: Malaysia's Corporate Network

The complex interconnections that define modern society are readily visible in our Facebook or LinkedIn networks. But what about the corporate world? I recently began mapping the web of cross-shareholding among Malaysia's listed corporations. Using Social Network Analysis (SNA), I visualized the ecosystem to identify key "communities" and power brokers. The goal? To see if a company's position in this web predicts its financial destiny. The State of Play (2015) Figure 1: Malaysia's Corporate Network in 2015 (Created via Gephi) The map above visualizes the network as of 2015. While I have excluded specific company names, the "super-nodes" (the largest circles) represent the most connected shareholders in the economy—primarily government-linked investment companies (GLICs), fund managers, and international asset managers. A Decade of Growing Complexity ...

The Labor Market Impacts of AI in Türkiye: Beyond Occupational Exposure Analysis

Beyond Exposure AI and Labor Markets · Türkiye Occupational exposure to AI identifies where technology may affect work, but not whether employment will contract, reorganize, or expand. Applying the Richmond (2026) AI Jobs Transition Framework to Türkiye's 2024 Household Labour Force Survey, the dominant high-exposure archetype is not automation. It is reorganization. Mpumelelo Nxumalo and Dhushyanth Raju · Summary of the working paper Beyond Exposure: AI and Labor Market Reorganization in Türkiye Most discussion of AI and jobs runs on a single number: how much of an occupation's task content a model can perform. That number identifies where technology reaches. It does not say what happens next. An exposed occupation may shed workers, or it may keep them while the work itself is rebuilt around the technology. Those are different outcomes, they call for different policy, and exposure alone cannot tell them apart. Applying the Richmond (202...

Mapping the Blast Radius: What Happens When the "World's Factory" Stops?

In global trade, "efficiency" often masks "fragility." We know that China is central to the global electronics supply chain, but how central? And if that node were to go dark, who would feel the shockwaves first? To answer this, I moved beyond standard trade statistics and built a network simulation using the OECD Inter-Country Input-Output (ICIO) Tables (2023 Edition) . This dataset maps the DNA of the global economy, tracking every dollar of input across 66 countries and 45 industries. 1. The Blast Radius: Tracing the Contagion I treated the global economy as a directed graph and simulated a total supply shock to Chinese Electronics (CHN_C26) . By tracing the flow of inputs across three tiers of buyers, I visualized the "Blast Radius" of this disruption. Fig 1: The Supply Chain Cascade. The shock originates in China (Red) and immediately hits "Tier 1" assembly hubs (Dark Blue) before cascading to global consumers...